HTTP Logs
Collect log information from request gateways and output it to an HTTP server to facilitate further operations such as log analysis.
Features
The HTTP log plugin sends node access logs to HTTP service interfaces via HTTP requests and has the following features:
- Supports various request methods including POST, PUT, PATCH
- Supports custom request headers
- Supports different log output format types
- Supports custom log formatting configuration
Operation Demonstration
Creating a New HTTP Log Configuration
- Click
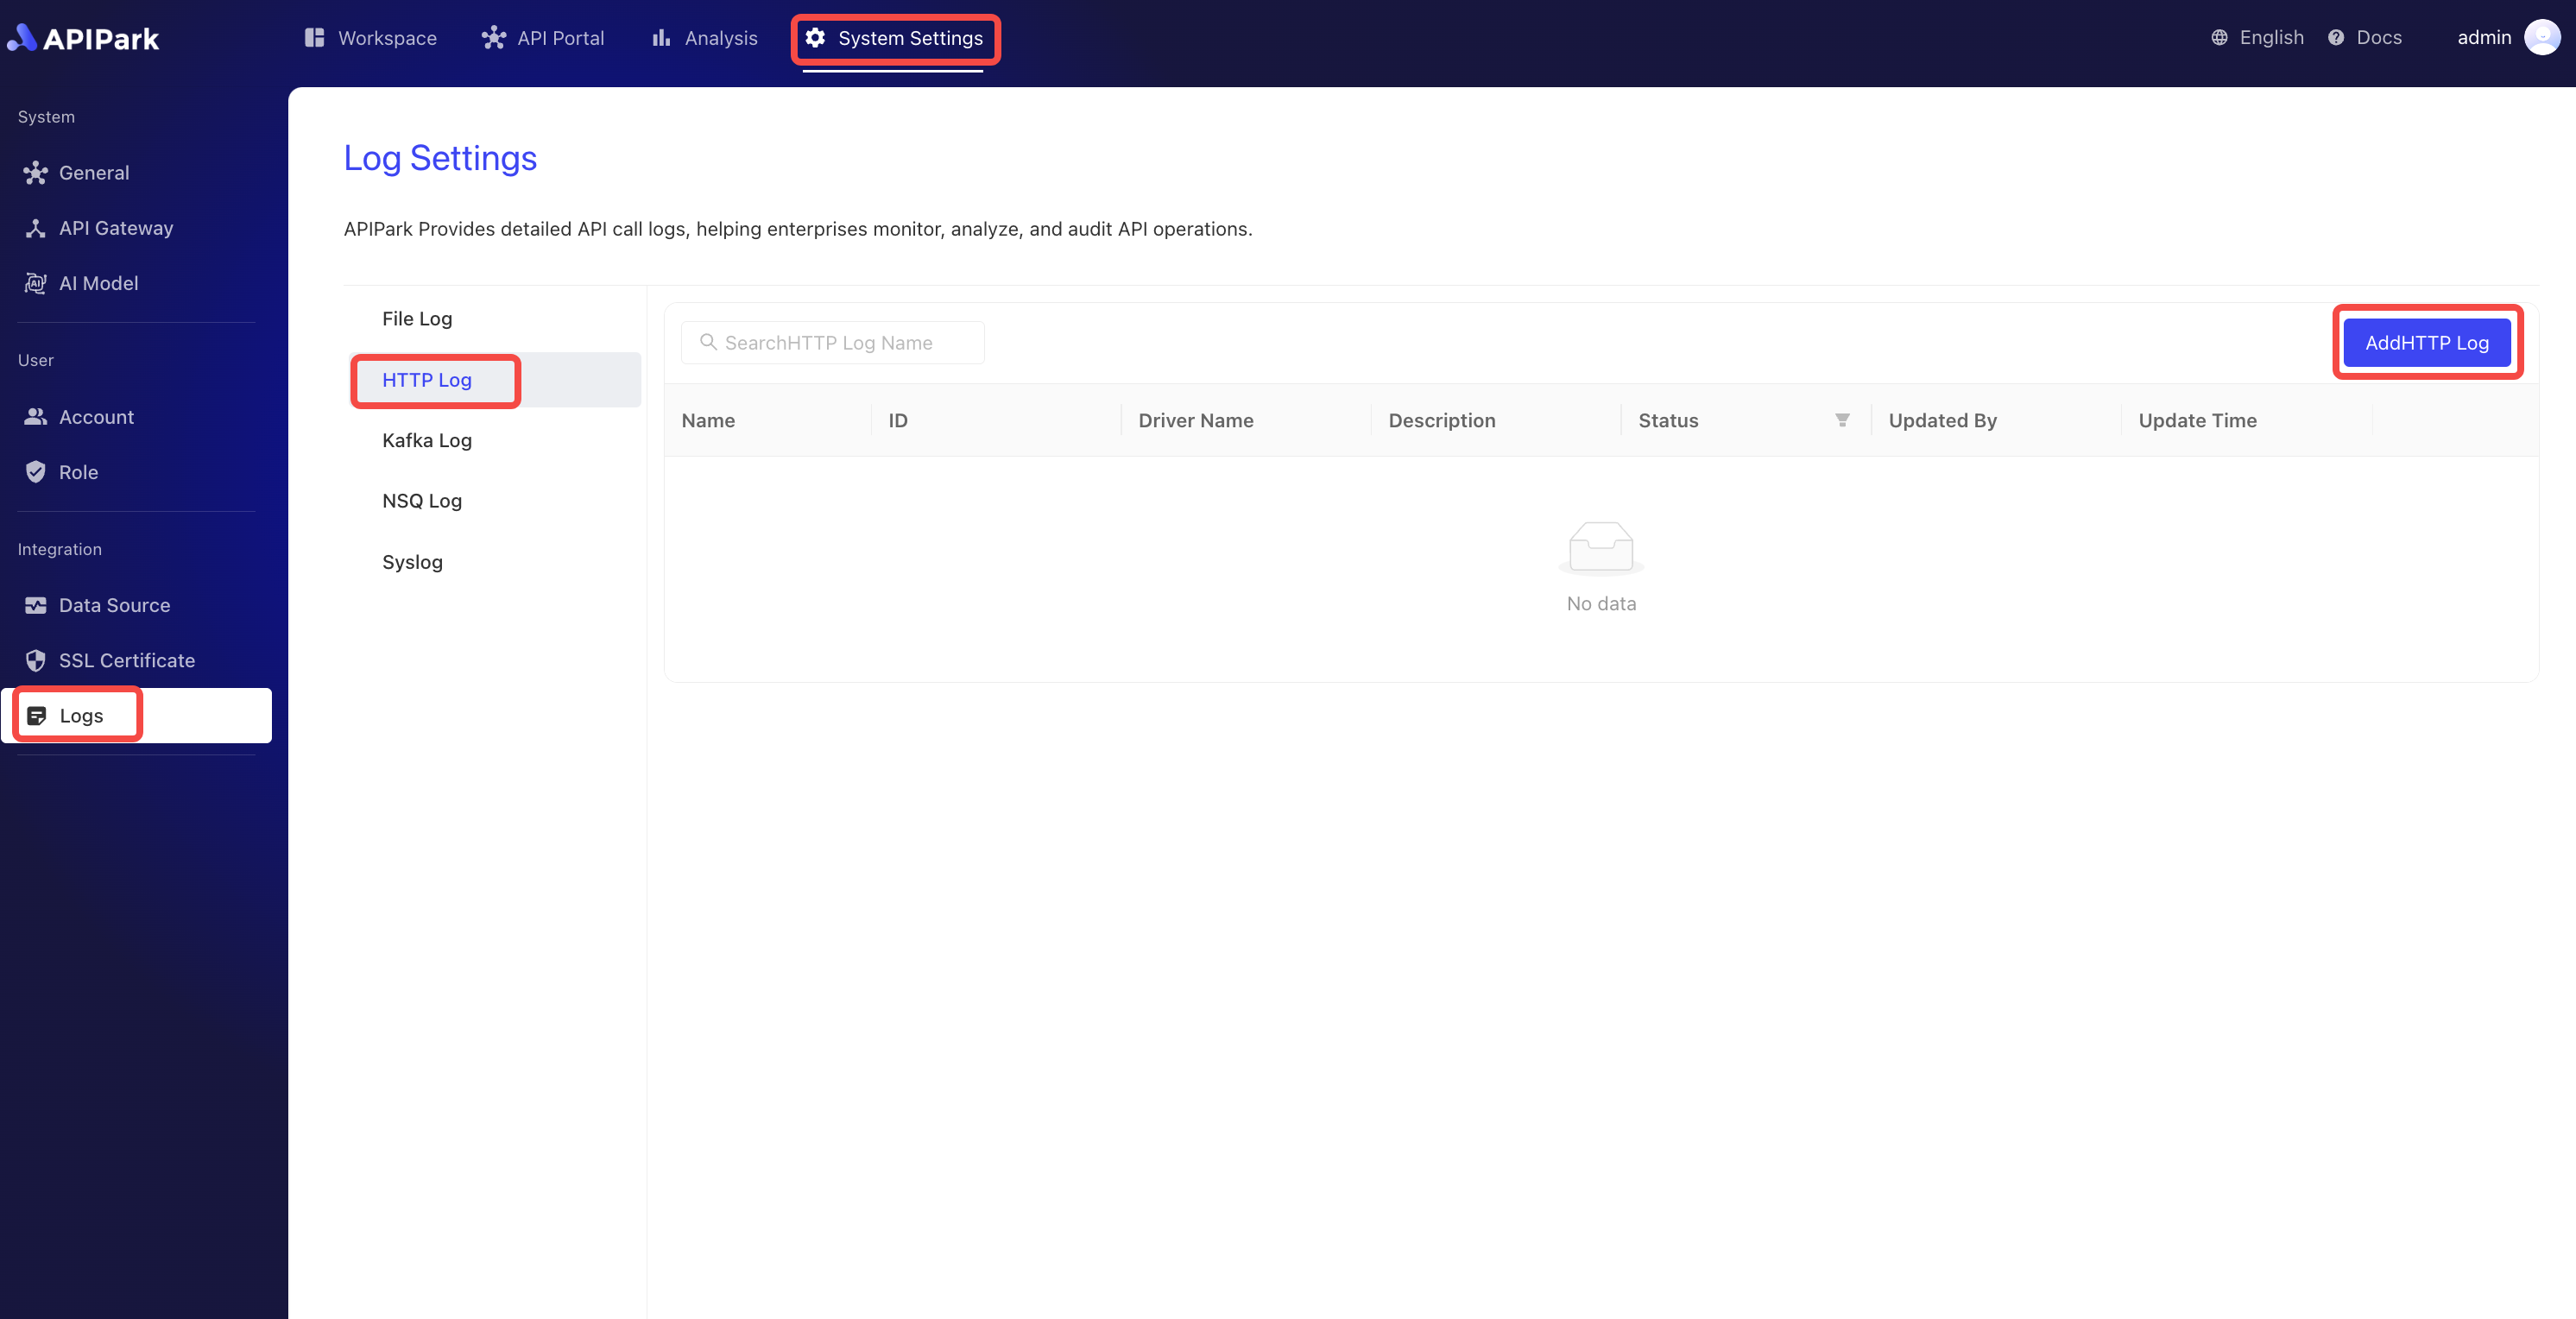
System Settings->Logs->HTTP Logs, then clickAdd HTTP Log.

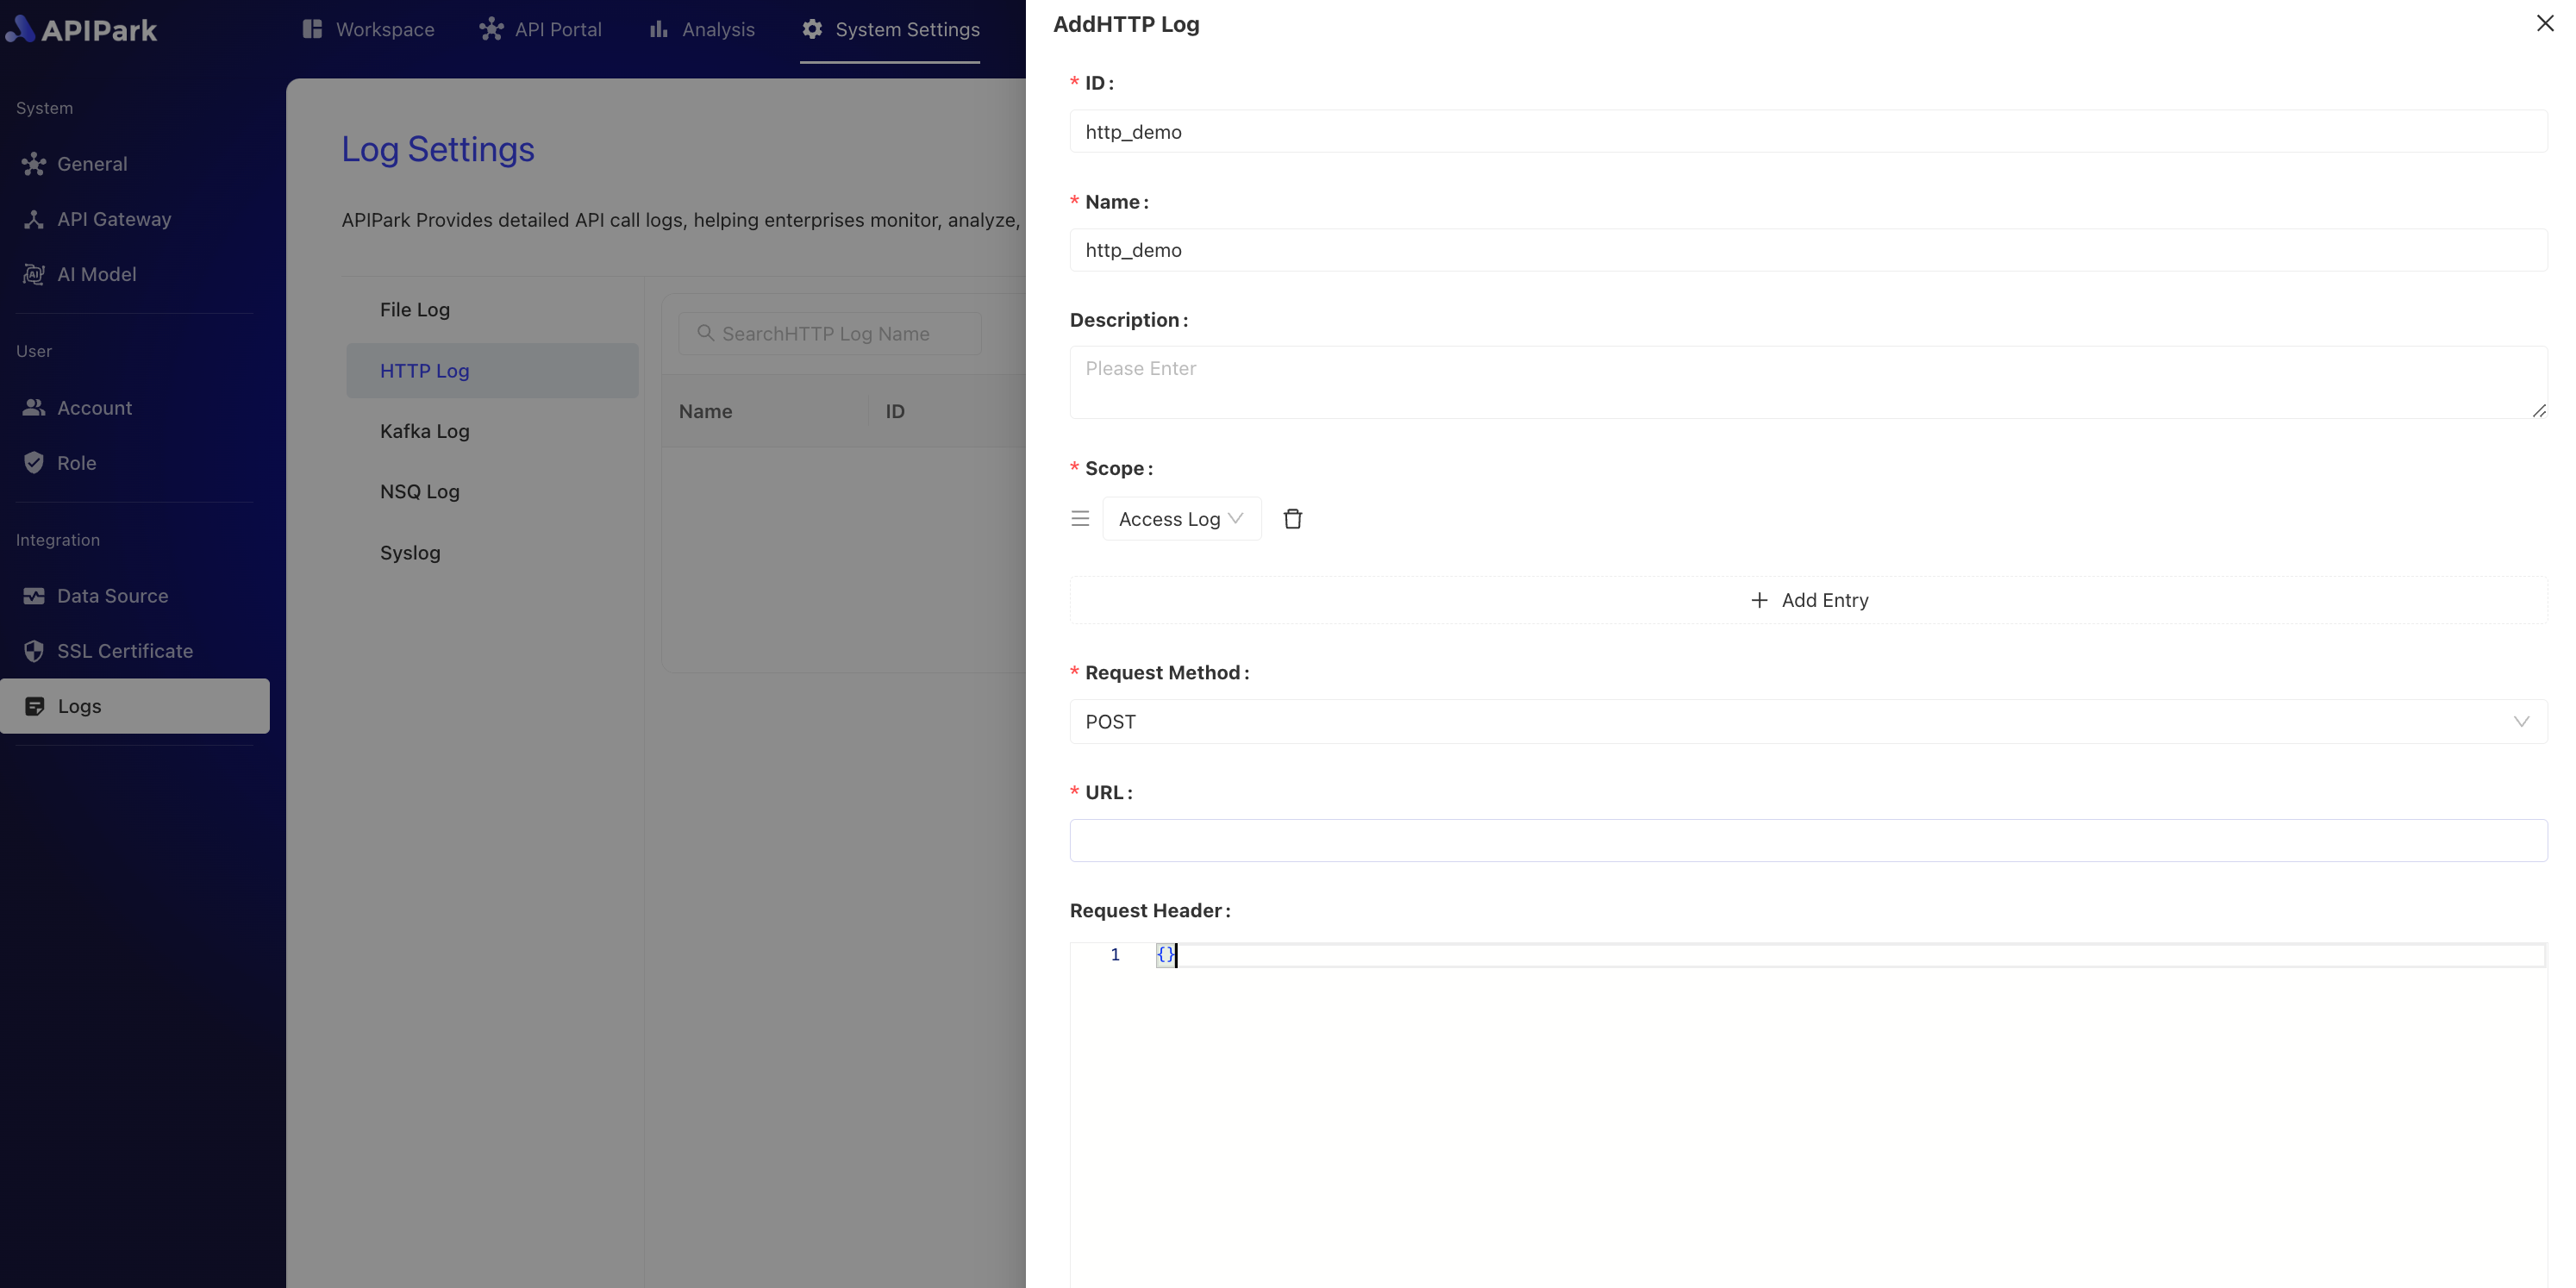
- Fill out the HTTP log configuration and click
Confirmonce completed.

Configuration Description:
| Field Name | Description |
|---|---|
| Request Method | The request method used when accessing the HTTP service interface. Currently supports POST, PUT, PATCH |
| URL | The complete request path to the HTTP service interface |
| Request Header | The header information for the request. This can include necessary parameters for accessing the HTTP service, such as authentication details. This information should be filled in using JSON format data in a key-value format, e.g., {"from":"apinto"} |
| Output Format | The format of the log output, supporting single-line and JSON format outputs |
| Formatting Configuration | Template for output format, configuration tutorial click here to navigate |
Formatting Configuration Example
{
   "fields": [
      "$time_iso8601",
      "$request_id",
      "@request",
      "@proxy",
      "@response",
      "@status_code",
      "@time"
   ],
   "request": [
      "$request_method",
      "$scheme",
      "$request_uri",
      "$host",
      "$header",
      "$remote_addr"
   ],
   "proxy": [
      "$proxy_method",
      "$proxy_scheme",
      "$proxy_uri",
      "$proxy_host",
      "$proxy_header",
      "$proxy_addr"
   ],
   "response": [
      "$response_headers"
   ],
   "status_code": [
      "$status",
      "$proxy_status"
   ],
   "time": [
      "$request_time",
      "$response_time"
   ]
}
Deployment
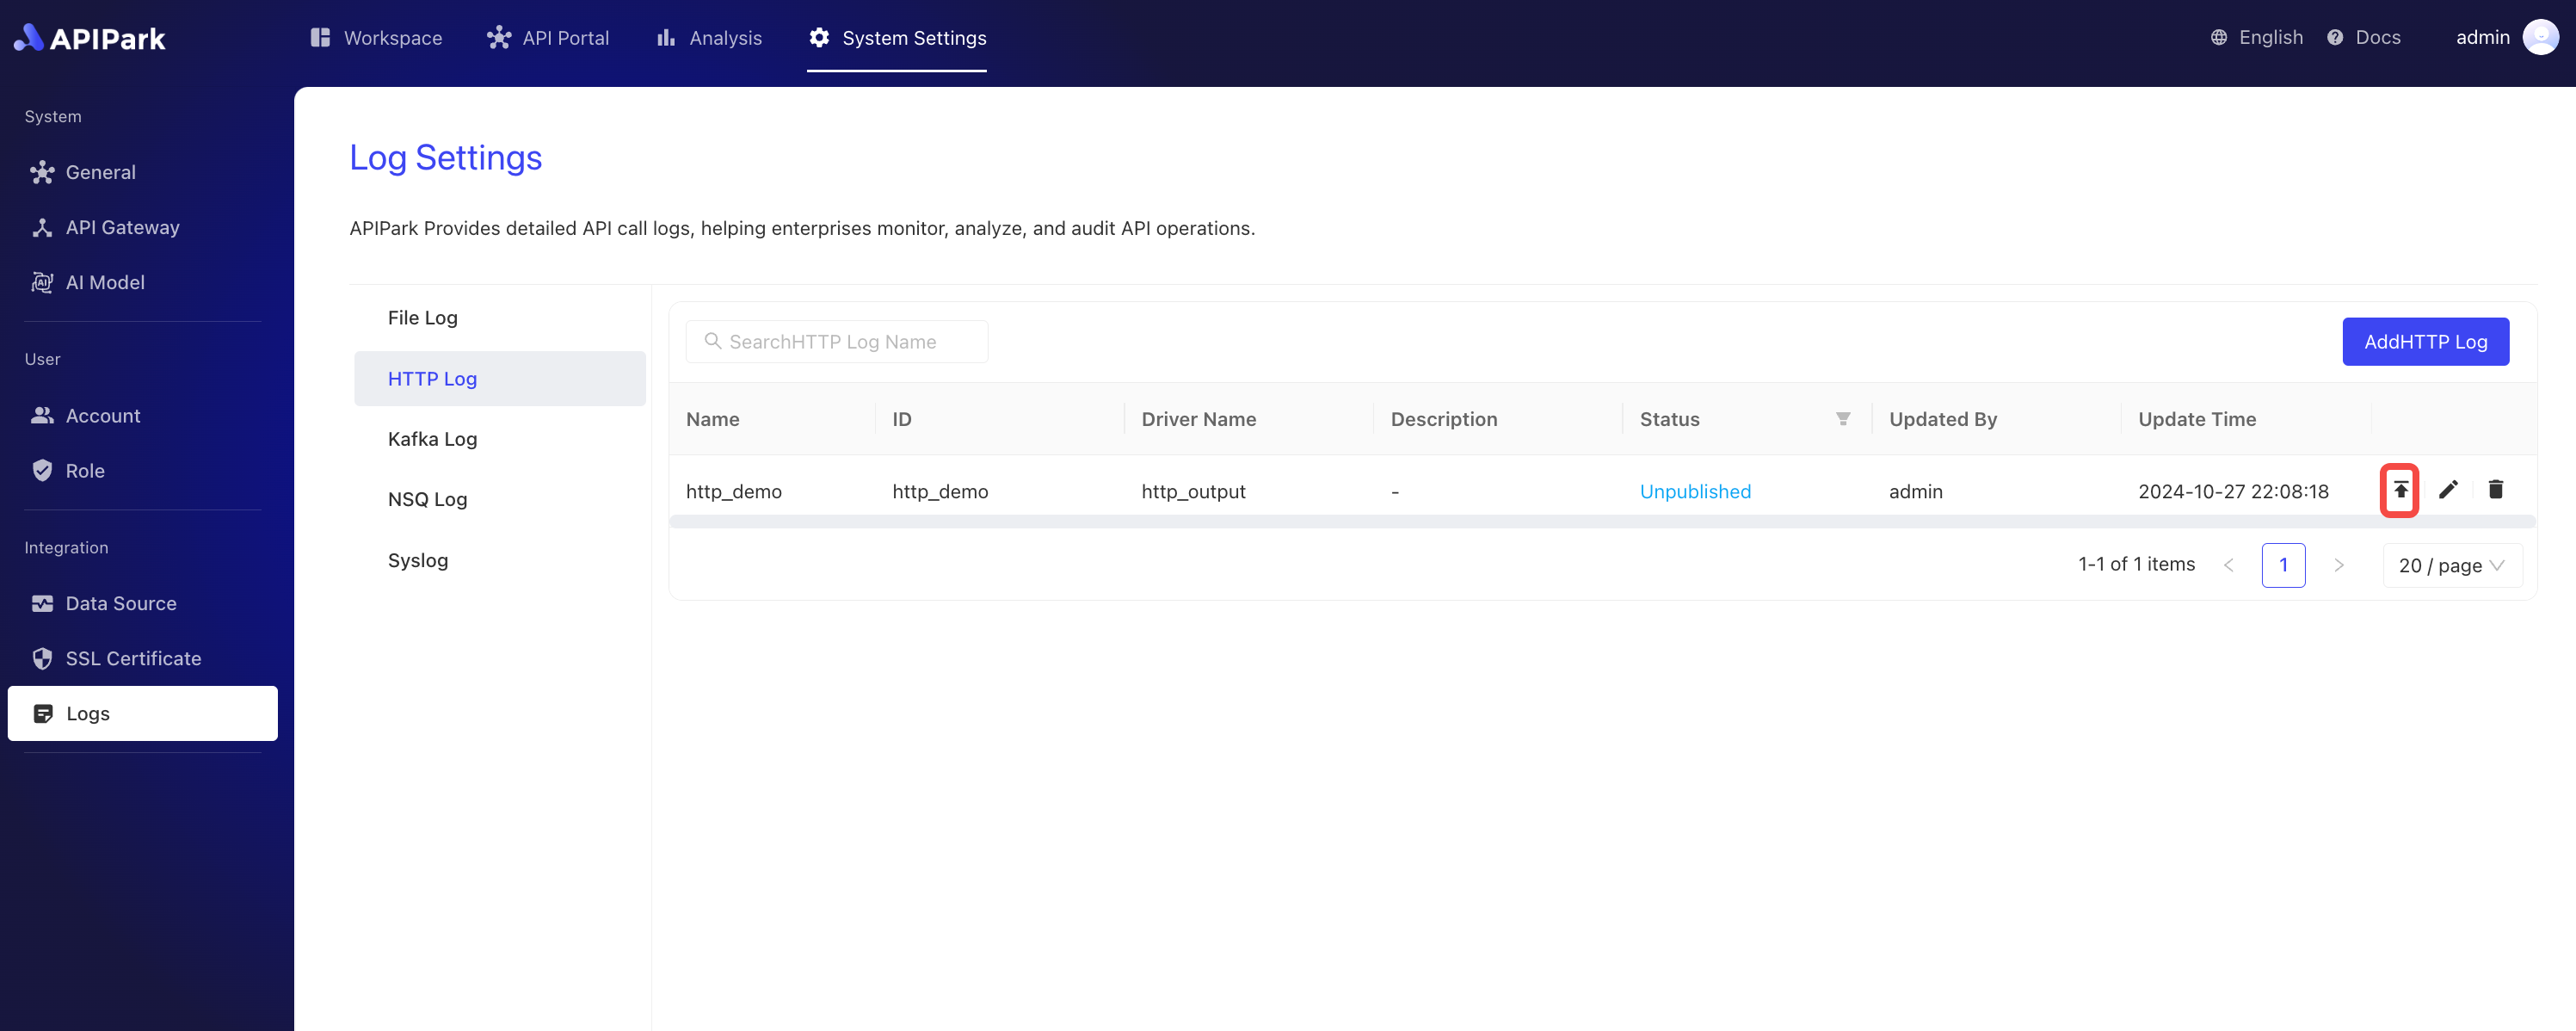
- Click the
Deploybutton next to the configuration you wish to deploy.
