HTTP Logs
Collect log information from the request gateway and output it to an HTTP server, making it easier for users to perform secondary operations such as log analysis.
Features
The HTTP log plugin sends node access logs to the HTTP service interface via HTTP requests and has the following features:
- Supports multiple request methods, including POST, PUT, PATCH
- Supports custom request headers
- Supports log output format types
- Supports custom log formatting configuration
Operation Demonstration
Create a New HTTP Log Configuration
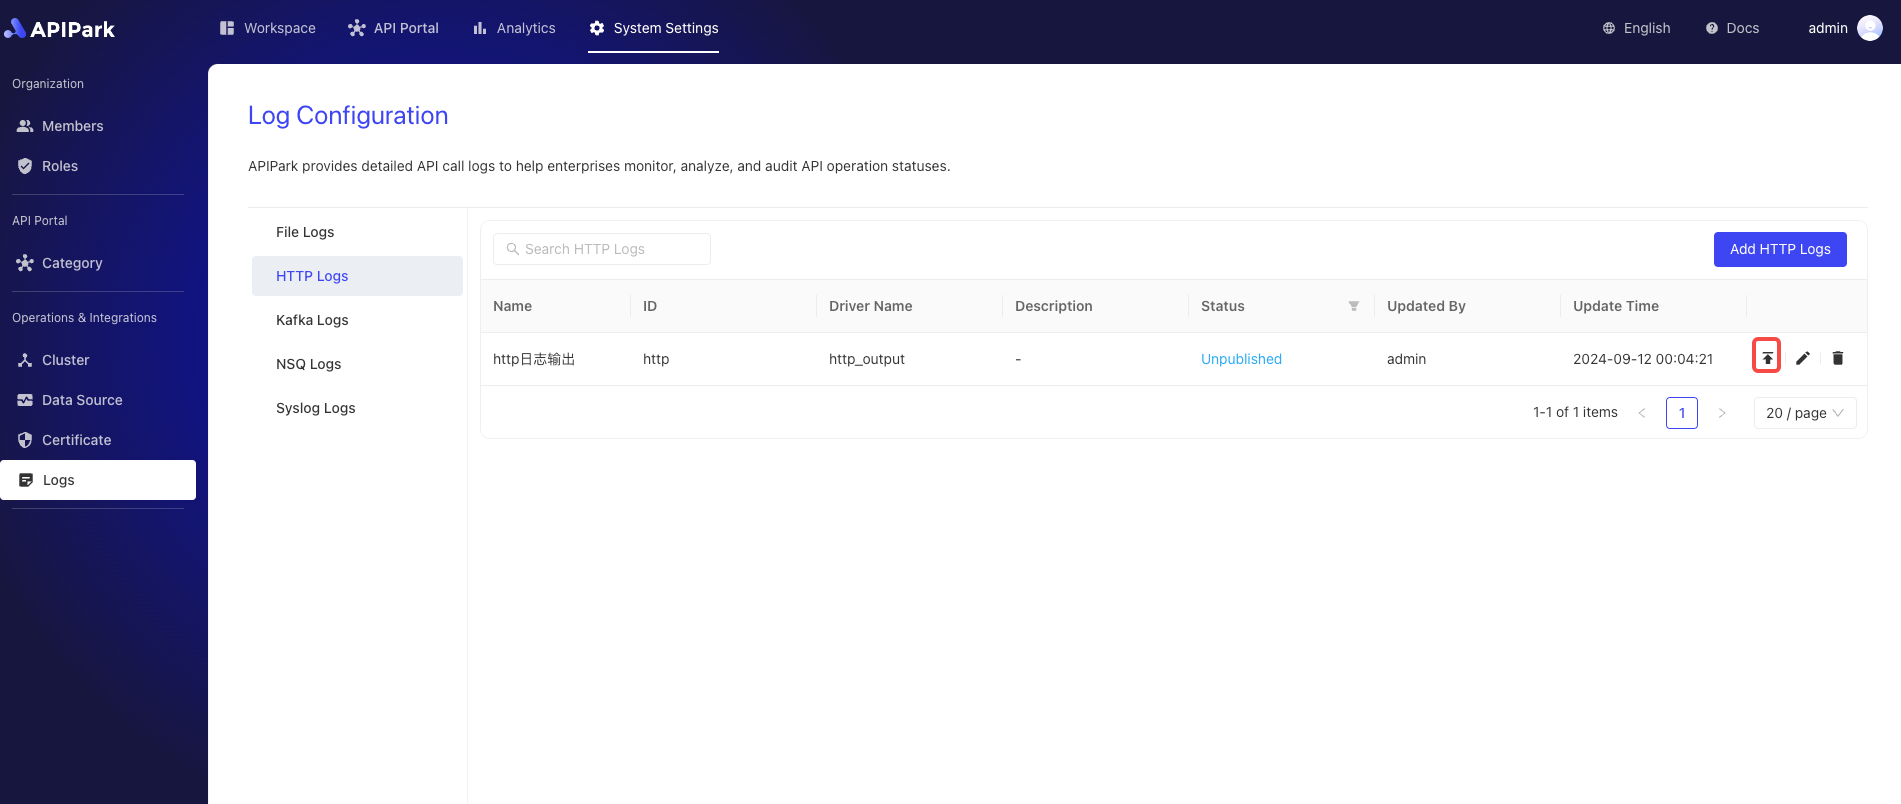
- Click on
System Settings->Operations and Integration->Logs->HTTP Logsin the left navigation bar, and then clickAdd HTTP Log.
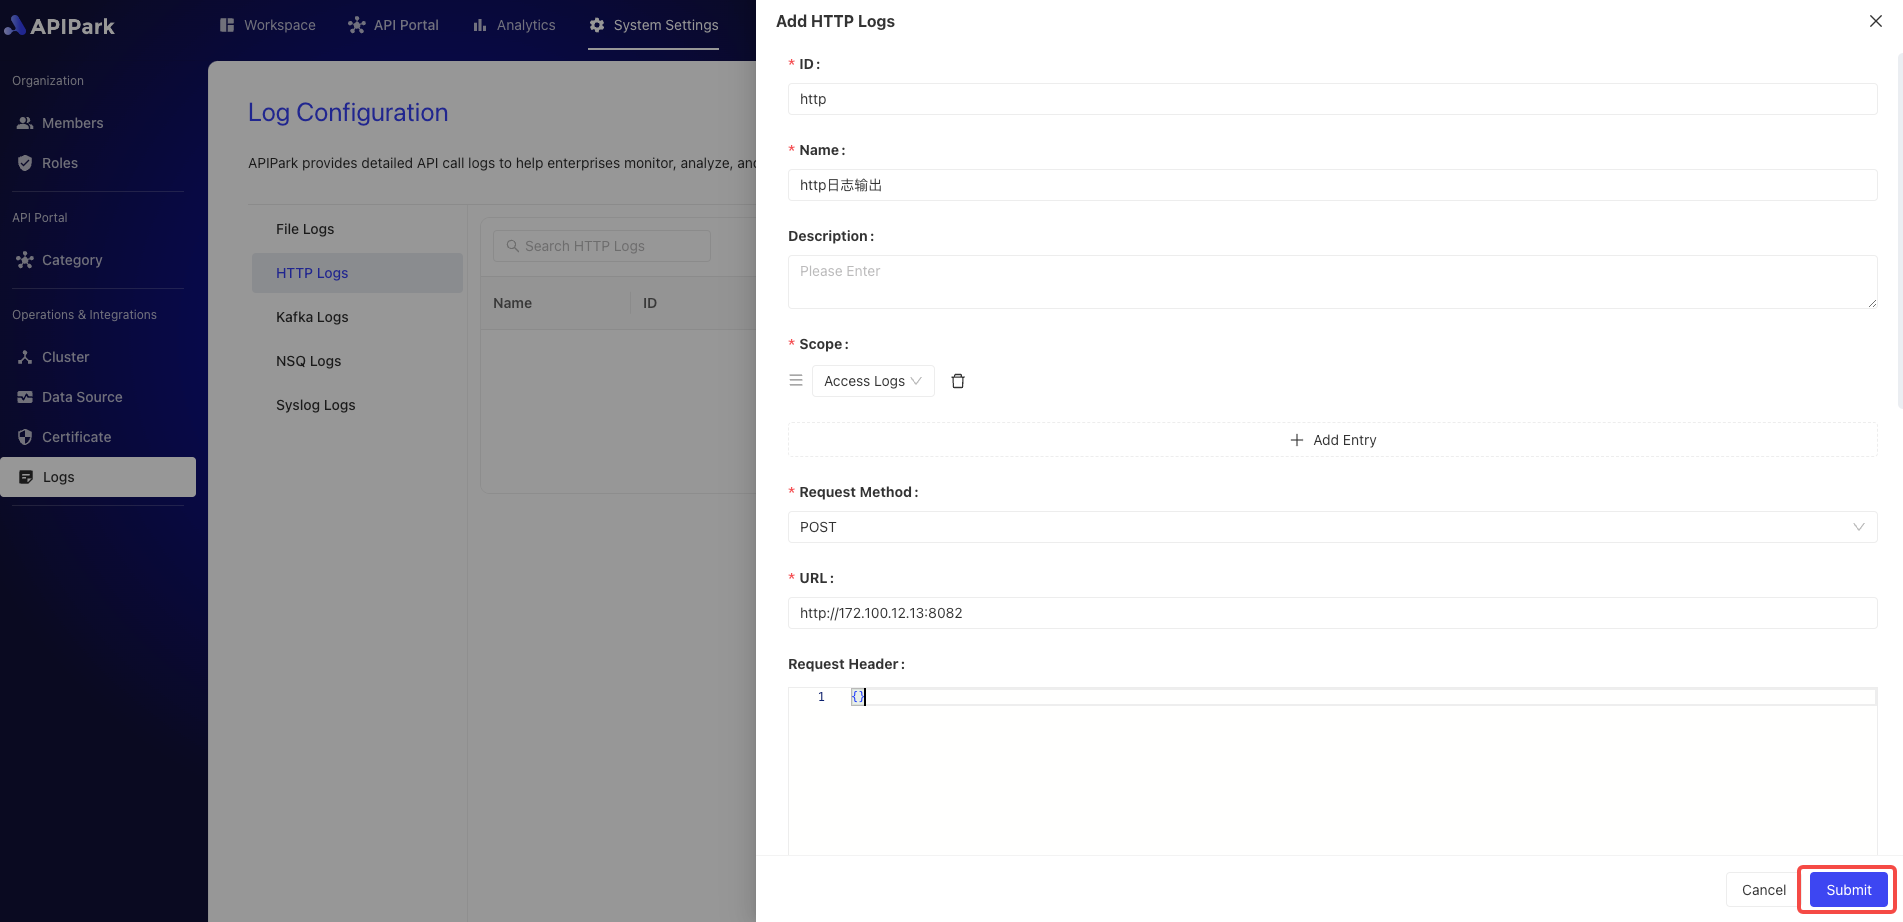
- HTTP Log Configuration
Configuration Description:
| Field Name | Description |
|---|---|
| Request Method | The request method used when requesting the HTTP service interface, currently supports POST, PUT, PATCH |
| URL | Full request path of the HTTP service interface |
| Request Header | Header information for the request, parameters required when requesting the HTTP service interface, such as authentication information. Please input in JSON format, data should be in key-value format, e.g., {"from":"apinto"} |
| Output Format | Log content output format, supports single line, Json format output |
| Format Configuration | Output format template, click here for the tutorial |
Format Configuration Example
{
   "fields": [
      "$time_iso8601",
      "$request_id",
      "@request",
      "@proxy",
      "@response",
      "@status_code",
      "@time"
   ],
   "request": [
      "$request_method",
      "$scheme",
      "$request_uri",
      "$host",
      "$header",
      "$remote_addr"
   ],
   "proxy": [
      "$proxy_method",
      "$proxy_scheme",
      "$proxy_uri",
      "$proxy_host",
      "$proxy_header",
      "$proxy_addr"
   ],
   "response": [
      "$response_header"
   ],
   "status_code": [
      "$status",
      "$proxy_status"
   ],
   "time": [
      "$request_time",
      "$response_time"
   ]
}