Deploy APIPark
Hardware Requirements
Recommended Configuration:
- CPU: 8 cores
- Memory: 16GB
- Disk Storage: 200GB
- Operating System: Linux / Mac
- System Architecture: AMD64 / ARM64
Minimum Configuration:
- CPU: 2 cores
- Memory: 4GB
- Disk Storage: 200GB
- Operating System: Linux / Mac
- System Architecture: AMD64 / ARM64
Program Dependencies
APIPark relies on MYSQL, Redis, InfluxDB databases. The required versions for these databases are:
| Name | Version Requirement |
|---|---|
| MYSQL | >=5.7.x |
| Redis | >=6.2.x |
| InfluxDB | >=2.6 |
Deployment Methods
Deploy using Script
Supported System List:
- CentOS 7.9 (representing 7.x)
- CentOS 8.5 (representing 8.x)
- Ubuntu 20.04
- Ubuntu 22.04
- Debian 12.4
- Alibaba Cloud Linux 3.2104
- Alibaba Cloud Linux 2.1903
Currently, the installations have only been tested for the above systems. If you need a one-click deployment for other systems, you can submit an Issue to us.
Enter the one-click deployment command:
curl -sSO https://download.apipark.com/install/quick-start.sh; bash quick-start.sh
Follow the prompts to deploy. After deployment is complete, deployment information will be displayed.
Docker-Compose Deployment
To install APIPark using this method, you need to install Docker and Docker Compose.
After the deployment, APIPark needs to bind with the API Gateway node to function. For detailed instructions, please refer to Configure API Gateway.
Deploy APIPark + API Gateway
- Edit
config.yml
vi config.yml
- Modify the file configuration
version: 2
#certificate: # Directory for storing certificates
#  dir: /etc/apinto/cert
client:
  advertise_urls: # Broadcast address of open api service
    - http://{IP}:9400
  listen_urls: # Listening address of open api service
    - http://0.0.0.0:9400
  #certificate:  # Certificate configuration, allows using self-signed certificates with IP
  #  - cert: server.pem
  #    key: server.key
gateway:
  advertise_urls: # Broadcast address of forwarding service
    - http://{IP}:8099
    - https://{IP}:8099
  listen_urls: # Listening address of forwarding service
    - https://0.0.0.0:8099
    - http://0.0.0.0:8099
peer: # Configuration information for communication between cluster nodes
  listen_urls: # Node listening address
    - http://0.0.0.0:9401
  advertise_urls: # Broadcast address for node communication
    - http://{IP}:9401
  #certificate:  # Certificate configuration, allows using self-signed certificates with IP
  #  - cert: server.pem
  #    key: server.key
In the above configuration, {IP} is a variable and should be replaced with the host IP of the container. Suppose the host IP is 172.18.65.22, then the configuration should be as follows:
version: 2
#certificate: # Directory for storing certificates
#  dir: /etc/apinto/cert
client:
  advertise_urls: # Broadcast address of open api service
    - http://172.18.65.22:9400
  listen_urls: # Listening address of open api service
    - http://0.0.0.0:9400
  #certificate:  # Certificate configuration, allows using self-signed certificates with IP
  #  - cert: server.pem
  #    key: server.key
gateway:
  advertise_urls: # Broadcast address of forwarding service
    - http://172.18.65.22:8099
    - https://172.18.65.22:8099
  listen_urls: # Listening address of forwarding service
    - https://0.0.0.0:8099
    - http://0.0.0.0:8099
peer: # Configuration information for communication between cluster nodes
  listen_urls: # Node listening address
    - http://0.0.0.0:9401
  advertise_urls: # Broadcast address for node communication
    - http://172.18.65.22:9401
  #certificate:  # Certificate configuration, allows using self-signed certificates with IP
  #  - cert: server.pem
  #    key: server.key
Configuration Description
| Field Name | Description |
|---|---|
| version | Configuration version number, default is 2 |
| client | openAPI configuration information |
| client -> listen_urls | List of openAPI listening addresses, format: {protocol}://{IP}:{port} |
| client -> advertise_urls | List of openAPI broadcast addresses, displayed in the console cluster node list, format: {protocol}://{IP/domain}:{port} |
| client -> certificate | List of openAPI certificate information |
| gateway | Configuration information for forwarding proxy core program |
| gateway -> listen_urls | List of forwarding proxy core program listening addresses, format: {protocol}://{IP}:{port} |
| gateway -> advertise_urls | List of forwarding proxy core program broadcast addresses, displayed in the console cluster node list, format: {protocol}://{IP/domain}:{port} |
| peer | Configuration information for Raft nodes, used for configuration synchronization, joining the cluster, leaving the cluster, etc. |
| peer -> listen_urls | List of Raft node listening addresses, format: {protocol}://{IP}:{port} |
| peer -> advertise_urls | List of Raft node broadcast addresses, format: {protocol}://{IP/domain}:{port} |
| peer -> certificate | List of Raft node certificate information |
- Edit
docker-compose.ymlfile
vi docker-compose.yml
- Modify the file configuration
version: '3'
services:
  apipark-mysql:
    image: mysql:8.0.37
    privileged: true
    restart: always
    container_name: apipark-mysql
    hostname: apipark-mysql
    command:
      - "--character-set-server=utf8mb4"
      - "--collation-server=utf8mb4_unicode_ci"
    ports:
      - "33306:3306"
    environment:
      - MYSQL_ROOT_PASSWORD={MYSQL_PWD}
      - MYSQL_DATABASE=apipark
    volumes:
      - /var/lib/apipark/mysql:/var/lib/mysql
    networks:
      - apipark
  apipark:
    image: apipark/apipark:v1.3.0-beta
    container_name: apipark
    privileged: true
    restart: always
    networks:
      - apipark
    ports:
      - "18288:8288"
    depends_on:
      - apipark-mysql
    environment:
      - MYSQL_USER_NAME=root
      - MYSQL_PWD={MYSQL_PWD}
      - MYSQL_IP=apipark-mysql
      - MYSQL_PORT=3306                 #mysql端口
      - MYSQL_DB="apipark"
      - ERROR_DIR=work/logs  # 日志放置目录
      - ERROR_FILE_NAME=error.log          # 错误日志文件名
      - ERROR_LOG_LEVEL=info               # 错误日志等级,可选:panic,fatal,error,warning,info,debug,trace 不填或者非法则为info
      - ERROR_EXPIRE=7d                    # 错误日志过期时间,默认单位为天,d|天,h|小时, 不合法配置默认为7d
      - ERROR_PERIOD=day                  # 错误日志切割周期,仅支持day、hour
      - REDIS_ADDR=apipark-redis:6379           #Redis集群地址 多个用,隔开
      - REDIS_PWD={REDIS_PWD}                         # Redis密码
      - ADMIN_PASSWORD={ADMIN_PASSWORD}
  influxdb2:
    image: influxdb:2.6
    privileged: true
    restart: always
    container_name: influxdb2
    hostname: influxdb2
    ports:
      - "8086:8086"
    volumes:
      - /var/lib/apipark/influxdb2:/var/lib/influxdb2
    networks:
      - apipark
  apipark-redis:
    container_name: apipark-redis
    image: redis:7.2.4
    hostname: apipark-redis
    privileged: true
    restart: always
    ports:
      - 6379:6379
    command:
      - bash
      - -c
      - "redis-server --protected-mode yes --logfile redis.log --appendonly no --port 6379 --requirepass {REDIS_PWD}"
    networks:
      - apipark
  apipark-loki:
    container_name: apipark-loki
    image:  grafana/loki:3.2.1
    hostname: apipark-loki
    privileged: true
    user: root
    restart: always
    ports:
      - 3100:3100
    entrypoint:
      - sh
      - -euc
      - |
        mkdir -p /mnt/config
        cat <<EOF > /mnt/config/loki-config.yaml
        ---
        auth_enabled: false

        server:
          http_listen_port: 3100
          grpc_listen_port: 9096

        common:
          instance_addr: 127.0.0.1
          path_prefix: /tmp/loki
          storage:
            filesystem:
              chunks_directory: /tmp/loki/chunks
              rules_directory: /tmp/loki/rules
          replication_factor: 1
          ring:
            kvstore:
              store: inmemory

        query_range:
          results_cache:
            cache:
              embedded_cache:
                enabled: true
                max_size_mb: 100

        schema_config:
          configs:
            - from: 2020-10-24
              store: tsdb
              object_store: filesystem
              schema: v13
              index:
                prefix: index_
                period: 24h
        limits_config:
          max_query_length: 90d # 设置最大查询时长为 30 天
        ruler:
          alertmanager_url: http://localhost:9093

        # By default, Loki will send anonymous, but uniquely-identifiable usage and configuration
        # analytics to Grafana Labs. These statistics are sent to https://stats.grafana.org/
        #
        # Statistics help us better understand how Loki is used, and they show us performance
        # levels for most users. This helps us prioritize features and documentation.
        # For more information on what's sent, look at
        # https://github.com/grafana/loki/blob/main/pkg/analytics/stats.go
        # Refer to the buildReport method to see what goes into a report.
        #
        # If you would like to disable reporting, uncomment the following lines:
        #analytics:
        #  reporting_enabled: false
        table_manager:
          retention_period: 90d
        EOF
        /usr/bin/loki -config.file=/mnt/config/loki-config.yaml
    networks:
      - apipark
  apipark-grafana:
    container_name: apipark-grafana
    image:  grafana/grafana:11.3.2
    hostname: apipark-grafana
    privileged: true
    restart: always
    environment:
      - GF_PATHS_PROVISIONING=/etc/grafana/provisioning
      - GF_AUTH_ANONYMOUS_ENABLED=true
      - GF_AUTH_ANONYMOUS_ORG_ROLE=Admin
    depends_on:
      - apipark-loki
    entrypoint:
      - sh
      - -euc
      - |
        mkdir -p /etc/grafana/provisioning/datasources
        cat <<EOF > /etc/grafana/provisioning/datasources/ds.yaml
        apiVersion: 1
        datasources:
          - name: Loki
            type: loki
            access: proxy
            url: http://apipark-loki:3100
        EOF
        /run.sh
    ports:
      - "3000:3000"
    healthcheck:
      test: [ "CMD-SHELL", "wget --no-verbose --tries=1 --spider http://localhost:3000/api/health || exit 1" ]
      interval: 10s
      timeout: 5s
      retries: 5
    networks:
      - apipark
  apipark-apinto:
    image: eolinker/apinto-gateway
    container_name: apipark-apinto
    privileged: true
    restart: always
    command:
      - ./start.sh
    ports:
      - "8099:8099"
      - "9400:9400"
      - "9401:9401"
    volumes:
      - /var/lib/apipark/apinto/data:/var/lib/apinto
      - /var/lib/apipark/apinto/log:/var/log/apinto
      - ${PWD}/config.yml:/etc/apinto/config.yml
    networks:
      - apipark
networks:
  apipark:
    driver: bridge
    ipam:
      driver: default
      config:
        - subnet: 172.100.0.0/24
In the above configuration, values within "" are variables. Descriptions of relevant variables are as follows:
- MYSQL_PWD: Initialization password for the MySQL database root user.
- REDIS_PWD: Redis password.
- ADMIN_PASSWORD: Initial password for APIPark Admin account.
Example of replaced configuration:
version: '3'
services:
  apipark-mysql:
    image: mysql:8.0.37
    privileged: true
    restart: always
    container_name: apipark-mysql
    hostname: apipark-mysql
    command:
      - "--character-set-server=utf8mb4"
      - "--collation-server=utf8mb4_unicode_ci"
    ports:
      - "33306:3306"
    environment:
      - MYSQL_ROOT_PASSWORD=123456
      - MYSQL_DATABASE=apipark
    volumes:
      - /var/lib/apipark/mysql:/var/lib/mysql
    networks:
      - apipark
  apipark:
    image: apipark/apipark:v1.3.0-beta
    container_name: apipark
    privileged: true
    restart: always
    networks:
      - apipark
    ports:
      - "18288:8288"
    depends_on:
      - apipark-mysql
    environment:
      - MYSQL_USER_NAME=root
      - MYSQL_PWD=123456
      - MYSQL_IP=apipark-mysql
      - MYSQL_PORT=3306                 #mysql端口
      - MYSQL_DB="apipark"
      - ERROR_DIR=work/logs  # 日志放置目录
      - ERROR_FILE_NAME=error.log          # 错误日志文件名
      - ERROR_LOG_LEVEL=info               # 错误日志等级,可选:panic,fatal,error,warning,info,debug,trace 不填或者非法则为info
      - ERROR_EXPIRE=7d                    # 错误日志过期时间,默认单位为天,d|天,h|小时, 不合法配置默认为7d
      - ERROR_PERIOD=day                  # 错误日志切割周期,仅支持day、hour
      - REDIS_ADDR=apipark-redis:6379           #Redis集群地址 多个用,隔开
      - REDIS_PWD=123456                         # Redis密码
      - ADMIN_PASSWORD=12345678
  influxdb2:
    image: influxdb:2.6
    privileged: true
    restart: always
    container_name: influxdb2
    hostname: influxdb2
    ports:
      - "8086:8086"
    volumes:
      - /var/lib/apipark/influxdb2:/var/lib/influxdb2
    networks:
      - apipark
  apipark-redis:
    container_name: apipark-redis
    image: redis:7.2.4
    hostname: apipark-redis
    privileged: true
    restart: always
    ports:
      - 6379:6379
    command:
      - bash
      - -c
      - "redis-server --protected-mode yes --logfile redis.log --appendonly no --port 6379 --requirepass 123456"
    networks:
      - apipark
  apipark-loki:
    container_name: apipark-loki
    image:  grafana/loki:3.2.1
    hostname: apipark-loki
    privileged: true
    user: root
    restart: always
    ports:
      - 3100:3100
    entrypoint:
      - sh
      - -euc
      - |
        mkdir -p /mnt/config
        cat <<EOF > /mnt/config/loki-config.yaml
        ---
        auth_enabled: false

        server:
          http_listen_port: 3100
          grpc_listen_port: 9096

        common:
          instance_addr: 127.0.0.1
          path_prefix: /tmp/loki
          storage:
            filesystem:
              chunks_directory: /tmp/loki/chunks
              rules_directory: /tmp/loki/rules
          replication_factor: 1
          ring:
            kvstore:
              store: inmemory

        query_range:
          results_cache:
            cache:
              embedded_cache:
                enabled: true
                max_size_mb: 100

        schema_config:
          configs:
            - from: 2020-10-24
              store: tsdb
              object_store: filesystem
              schema: v13
              index:
                prefix: index_
                period: 24h
        limits_config:
          max_query_length: 90d # 设置最大查询时长为 30 天
        ruler:
          alertmanager_url: http://localhost:9093

        # By default, Loki will send anonymous, but uniquely-identifiable usage and configuration
        # analytics to Grafana Labs. These statistics are sent to https://stats.grafana.org/
        #
        # Statistics help us better understand how Loki is used, and they show us performance
        # levels for most users. This helps us prioritize features and documentation.
        # For more information on what's sent, look at
        # https://github.com/grafana/loki/blob/main/pkg/analytics/stats.go
        # Refer to the buildReport method to see what goes into a report.
        #
        # If you would like to disable reporting, uncomment the following lines:
        #analytics:
        #  reporting_enabled: false
        table_manager:
          retention_period: 90d
        EOF
        /usr/bin/loki -config.file=/mnt/config/loki-config.yaml
    networks:
      - apipark
  apipark-grafana:
    container_name: apipark-grafana
    image:  grafana/grafana:11.3.2
    hostname: apipark-grafana
    privileged: true
    restart: always
    environment:
      - GF_PATHS_PROVISIONING=/etc/grafana/provisioning
      - GF_AUTH_ANONYMOUS_ENABLED=true
      - GF_AUTH_ANONYMOUS_ORG_ROLE=Admin
    depends_on:
      - apipark-loki
    entrypoint:
      - sh
      - -euc
      - |
        mkdir -p /etc/grafana/provisioning/datasources
        cat <<EOF > /etc/grafana/provisioning/datasources/ds.yaml
        apiVersion: 1
        datasources:
          - name: Loki
            type: loki
            access: proxy
            url: http://apipark-loki:3100
        EOF
        /run.sh
    ports:
      - "3000:3000"
    healthcheck:
      test: [ "CMD-SHELL", "wget --no-verbose --tries=1 --spider http://localhost:3000/api/health || exit 1" ]
      interval: 10s
      timeout: 5s
      retries: 5
    networks:
      - apipark
  apipark-apinto:
    image: eolinker/apinto-gateway
    container_name: apipark-apinto
    privileged: true
    restart: always
    command:
      - ./start.sh
    ports:
      - "8099:8099"
      - "9400:9400"
      - "9401:9401"
    volumes:
      - /var/lib/apipark/apinto/data:/var/lib/apinto
      - /var/lib/apipark/apinto/log:/var/log/apinto
      - ${PWD}/config.yml:/etc/apinto/config.yml
    networks:
      - apipark
networks:
  apipark:
    driver: bridge
    ipam:
      driver: default
      config:
        - subnet: 172.100.0.0/24
- Start APIPark
docker-compose up -d
After execution, the following images will be displayed:


Independently Deploy APIPark
- Edit
docker-compose.ymlfile
vi docker-compose.yml
- Modify the file configuration
version: '3'
services:
  apipark-mysql:
    image: mysql:8.0.37
    privileged: true
    restart: always
    container_name: apipark-mysql
    hostname: apipark-mysql
    command:
      - "--character-set-server=utf8mb4"
      - "--collation-server=utf8mb4_unicode_ci"
    ports:
      - "33306:3306"
    environment:
      - MYSQL_ROOT_PASSWORD={MYSQL_PWD}
      - MYSQL_DATABASE=apipark
    volumes:
      - /var/lib/apipark/mysql:/var/lib/mysql
    networks:
      - apipark
  apipark:
    image: apipark/apipark:v1.3.0-beta
    container_name: apipark
    privileged: true
    restart: always
    networks:
      - apipark
    ports:
      - "18288:8288"
    depends_on:
      - apipark-mysql
    environment:
      - MYSQL_USER_NAME=root
      - MYSQL_PWD={MYSQL_PWD}
      - MYSQL_IP=apipark-mysql
      - MYSQL_PORT=3306                 #mysql端口
      - MYSQL_DB="apipark"
      - ERROR_DIR=work/logs  # 日志放置目录
      - ERROR_FILE_NAME=error.log          # 错误日志文件名
      - ERROR_LOG_LEVEL=info               # 错误日志等级,可选:panic,fatal,error,warning,info,debug,trace 不填或者非法则为info
      - ERROR_EXPIRE=7d                    # 错误日志过期时间,默认单位为天,d|天,h|小时, 不合法配置默认为7d
      - ERROR_PERIOD=day                  # 错误日志切割周期,仅支持day、hour
      - REDIS_ADDR=apipark-redis:6379           #Redis集群地址 多个用,隔开
      - REDIS_PWD={REDIS_PWD}                         # Redis密码
      - ADMIN_PASSWORD={ADMIN_PASSWORD}
  influxdb2:
    image: influxdb:2.6
    privileged: true
    restart: always
    container_name: influxdb2
    hostname: influxdb2
    ports:
      - "8086:8086"
    volumes:
      - /var/lib/apipark/influxdb2:/var/lib/influxdb2
    networks:
      - apipark
  apipark-redis:
    container_name: apipark-redis
    image: redis:7.2.4
    hostname: apipark-redis
    privileged: true
    restart: always
    ports:
      - 6379:6379
    command:
      - bash
      - -c
      - "redis-server --protected-mode yes --logfile redis.log --appendonly no --port 6379 --requirepass {REDIS_PWD}"
    networks:
      - apipark
  apipark-loki:
    container_name: apipark-loki
    image:  grafana/loki:3.2.1
    hostname: apipark-loki
    privileged: true
    user: root
    restart: always
    ports:
      - 3100:3100
    entrypoint:
      - sh
      - -euc
      - |
        mkdir -p /mnt/config
        cat <<EOF > /mnt/config/loki-config.yaml
        ---
        auth_enabled: false

        server:
          http_listen_port: 3100
          grpc_listen_port: 9096

        common:
          instance_addr: 127.0.0.1
          path_prefix: /tmp/loki
          storage:
            filesystem:
              chunks_directory: /tmp/loki/chunks
              rules_directory: /tmp/loki/rules
          replication_factor: 1
          ring:
            kvstore:
              store: inmemory

        query_range:
          results_cache:
            cache:
              embedded_cache:
                enabled: true
                max_size_mb: 100

        schema_config:
          configs:
            - from: 2020-10-24
              store: tsdb
              object_store: filesystem
              schema: v13
              index:
                prefix: index_
                period: 24h
        limits_config:
          max_query_length: 90d # 设置最大查询时长为 30 天
        ruler:
          alertmanager_url: http://localhost:9093

        # By default, Loki will send anonymous, but uniquely-identifiable usage and configuration
        # analytics to Grafana Labs. These statistics are sent to https://stats.grafana.org/
        #
        # Statistics help us better understand how Loki is used, and they show us performance
        # levels for most users. This helps us prioritize features and documentation.
        # For more information on what's sent, look at
        # https://github.com/grafana/loki/blob/main/pkg/analytics/stats.go
        # Refer to the buildReport method to see what goes into a report.
        #
        # If you would like to disable reporting, uncomment the following lines:
        #analytics:
        #  reporting_enabled: false
        table_manager:
          retention_period: 90d
        EOF
        /usr/bin/loki -config.file=/mnt/config/loki-config.yaml
    networks:
      - apipark
  apipark-grafana:
    container_name: apipark-grafana
    image:  grafana/grafana:11.3.2
    hostname: apipark-grafana
    privileged: true
    restart: always
    environment:
      - GF_PATHS_PROVISIONING=/etc/grafana/provisioning
      - GF_AUTH_ANONYMOUS_ENABLED=true
      - GF_AUTH_ANONYMOUS_ORG_ROLE=Admin
    depends_on:
      - apipark-loki
    entrypoint:
      - sh
      - -euc
      - |
        mkdir -p /etc/grafana/provisioning/datasources
        cat <<EOF > /etc/grafana/provisioning/datasources/ds.yaml
        apiVersion: 1
        datasources:
          - name: Loki
            type: loki
            access: proxy
            url: http://apipark-loki:3100
        EOF
        /run.sh
    ports:
      - "3000:3000"
    healthcheck:
      test: [ "CMD-SHELL", "wget --no-verbose --tries=1 --spider http://localhost:3000/api/health || exit 1" ]
      interval: 10s
      timeout: 5s
      retries: 5
    networks:
      - apipark
networks:
  apipark:
    driver: bridge
    ipam:
      driver: default
      config:
        - subnet: 172.100.0.0/24
In the above configuration, values within "" are variables. Descriptions of relevant variables are as follows:
- MYSQL_PWD: Initialization password for the MySQL database root user.
- REDIS_PWD: Redis password.
- ADMIN_PASSWORD: Initial password for APIPark Admin account.
Example of replaced configuration:
version: '3'
services:
  apipark-mysql:
    image: mysql:8.0.37
    privileged: true
    restart: always
    container_name: apipark-mysql
    hostname: apipark-mysql
    command:
      - "--character-set-server=utf8mb4"
      - "--collation-server=utf8mb4_unicode_ci"
    ports:
      - "33306:3306"
    environment:
      - MYSQL_ROOT_PASSWORD=123456
      - MYSQL_DATABASE=apipark
    volumes:
      - /var/lib/apipark/mysql:/var/lib/mysql
    networks:
      - apipark
  apipark:
    image: apipark/apipark:v1.5.0-beta
    container_name: apipark
    privileged: true
    restart: always
    networks:
      - apipark
    ports:
      - "18288:8288"
    depends_on:
      - apipark-mysql
    environment:
      - MYSQL_USER_NAME=root
      - MYSQL_PWD=123456
      - MYSQL_IP=apipark-mysql
      - MYSQL_PORT=3306                 #mysql端口
      - MYSQL_DB="apipark"
      - ERROR_DIR=work/logs  # 日志放置目录
      - ERROR_FILE_NAME=error.log          # 错误日志文件名
      - ERROR_LOG_LEVEL=info               # 错误日志等级,可选:panic,fatal,error,warning,info,debug,trace 不填或者非法则为info
      - ERROR_EXPIRE=7d                    # 错误日志过期时间,默认单位为天,d|天,h|小时, 不合法配置默认为7d
      - ERROR_PERIOD=day                  # 错误日志切割周期,仅支持day、hour
      - REDIS_ADDR=apipark-redis:6379           #Redis集群地址 多个用,隔开
      - REDIS_PWD=123456                         # Redis密码
      - ADMIN_PASSWORD=12345678
  influxdb2:
    image: influxdb:2.6
    privileged: true
    restart: always
    container_name: influxdb2
    hostname: influxdb2
    ports:
      - "8086:8086"
    volumes:
      - /var/lib/apipark/influxdb2:/var/lib/influxdb2
    networks:
      - apipark
  apipark-redis:
    container_name: apipark-redis
    image: redis:7.2.4
    hostname: apipark-redis
    privileged: true
    restart: always
    ports:
      - 6379:6379
    command:
      - bash
      - -c
      - "redis-server --protected-mode yes --logfile redis.log --appendonly no --port 6379 --requirepass 123456"
    networks:
      - apipark
  apipark-loki:
    container_name: apipark-loki
    image:  grafana/loki:3.2.1
    hostname: apipark-loki
    privileged: true
    user: root
    restart: always
    ports:
      - 3100:3100
    entrypoint:
      - sh
      - -euc
      - |
        mkdir -p /mnt/config
        cat <<EOF > /mnt/config/loki-config.yaml
        ---
        auth_enabled: false

        server:
          http_listen_port: 3100
          grpc_listen_port: 9096

        common:
          instance_addr: 127.0.0.1
          path_prefix: /tmp/loki
          storage:
            filesystem:
              chunks_directory: /tmp/loki/chunks
              rules_directory: /tmp/loki/rules
          replication_factor: 1
          ring:
            kvstore:
              store: inmemory

        query_range:
          results_cache:
            cache:
              embedded_cache:
                enabled: true
                max_size_mb: 100

        schema_config:
          configs:
            - from: 2020-10-24
              store: tsdb
              object_store: filesystem
              schema: v13
              index:
                prefix: index_
                period: 24h
        limits_config:
          max_query_length: 90d # 设置最大查询时长为 30 天
        ruler:
          alertmanager_url: http://localhost:9093

        # By default, Loki will send anonymous, but uniquely-identifiable usage and configuration
        # analytics to Grafana Labs. These statistics are sent to https://stats.grafana.org/
        #
        # Statistics help us better understand how Loki is used, and they show us performance
        # levels for most users. This helps us prioritize features and documentation.
        # For more information on what's sent, look at
        # https://github.com/grafana/loki/blob/main/pkg/analytics/stats.go
        # Refer to the buildReport method to see what goes into a report.
        #
        # If you would like to disable reporting, uncomment the following lines:
        #analytics:
        #  reporting_enabled: false
        table_manager:
          retention_period: 90d
        EOF
        /usr/bin/loki -config.file=/mnt/config/loki-config.yaml
    networks:
      - apipark
  apipark-grafana:
    container_name: apipark-grafana
    image:  grafana/grafana:11.3.2
    hostname: apipark-grafana
    privileged: true
    restart: always
    environment:
      - GF_PATHS_PROVISIONING=/etc/grafana/provisioning
      - GF_AUTH_ANONYMOUS_ENABLED=true
      - GF_AUTH_ANONYMOUS_ORG_ROLE=Admin
    depends_on:
      - apipark-loki
    entrypoint:
      - sh
      - -euc
      - |
        mkdir -p /etc/grafana/provisioning/datasources
        cat <<EOF > /etc/grafana/provisioning/datasources/ds.yaml
        apiVersion: 1
        datasources:
          - name: Loki
            type: loki
            access: proxy
            url: http://apipark-loki:3100
        EOF
        /run.sh
    ports:
      - "3000:3000"
    healthcheck:
      test: [ "CMD-SHELL", "wget --no-verbose --tries=1 --spider http://localhost:3000/api/health || exit 1" ]
      interval: 10s
      timeout: 5s
      retries: 5
    networks:
      - apipark
networks:
  apipark:
    driver: bridge
    ipam:
      driver: default
      config:
        - subnet: 172.100.0.0/24
- Start APIPark
docker-compose up -d
After execution, the following images will be displayed:


Independently Deploy API Gateway
- Edit
config.yml
vi config.yml
- Modify file configuration
version: 2
#certificate: # Directory for storing certificates
#  dir: /etc/apinto/cert
client:
  advertise_urls: # Broadcast address of open api service
    - http://{IP}:9400
  listen_urls: # Listening address of open api service
    - http://0.0.0.0:9400
  #certificate:  # Certificate configuration, allows using self-signed certificates with IP
  #  - cert: server.pem
  #    key: server.key
gateway:
  advertise_urls: # Broadcast address of forwarding service
    - http://{IP}:8099
    - https://{IP}:8099
  listen_urls: # Listening address of forwarding service
    - https://0.0.0.0:8099
    - http://0.0.0.0:8099
peer: # Configuration information for communication between cluster nodes
  listen_urls: # Node listening address
    - http://0.0.0.0:9401
  advertise_urls: # Broadcast address for node communication
    - http://{IP}:9401
  #certificate:  # Certificate configuration, allows using self-signed certificates with IP
  #  - cert: server.pem
  #    key: server.key
In the above configuration, {IP} is a variable and should be replaced with the host IP of the container. Suppose the host IP is 172.18.65.22, then the configuration should be as follows:
version: 2
#certificate: # Directory for storing certificates
#  dir: /etc/apinto/cert
client:
  advertise_urls: # Broadcast address of open api service
    - http://172.18.65.22:9400
  listen_urls: # Listening address of open api service
    - http://0.0.0.0:9400
  #certificate:  # Certificate configuration, allows using self-signed certificates with IP
  #  - cert: server.pem
  #    key: server.key
gateway:
  advertise_urls: # Broadcast address of forwarding service
    - http://172.18.65.22:8099
    - https://172.18.65.22:8099
  listen_urls: # Listening address of forwarding service
    - https://0.0.0.0:8099
    - http://0.0.0.0:8099
peer: # Configuration information for communication between cluster nodes
  listen_urls: # Node listening address
    - http://0.0.0.0:9401
  advertise_urls: # Broadcast address for node communication
    - http://172.18.65.22:9401
  #certificate:  # Certificate configuration, allows using self-signed certificates with IP
  #  - cert: server.pem
  #    key: server.key
Configuration Description
| Field Name | Description |
|---|---|
| version | Configuration version number, default is 2 |
| client | openAPI configuration information |
| client -> listen_urls | List of openAPI listening addresses, format: {protocol}://{IP}:{port} |
| client -> advertise_urls | List of openAPI broadcast addresses, displayed in the console cluster node list, format: {protocol}://{IP/domain}:{port} |
| client -> certificate | List of openAPI certificate information |
| gateway | Configuration information for forwarding proxy core program |
| gateway -> listen_urls | List of forwarding proxy core program listening addresses, format: {protocol}://{IP}:{port} |
| gateway -> advertise_urls | List of forwarding proxy core program broadcast addresses, displayed in the console cluster node list, format: {protocol}://{IP/domain}:{port} |
| peer | Configuration information for Raft nodes, used for configuration synchronization, joining the cluster, leaving the cluster, etc. |
| peer -> listen_urls | List of Raft node listening addresses, format: {protocol}://{IP}:{port} |
| peer -> advertise_urls | List of Raft node broadcast addresses, format: {protocol}://{IP/domain}:{port} |
| peer -> certificate | List of Raft node certificate information |
- Run Docker container and mount configuration file
config.yml
docker run -td  -p 8099:8099 -p 9400:9400 -p 9401:9401 --privileged=true \
-v /var/lib/apinto/data:/var/lib/apinto \
-v /var/lib/apinto/log:/var/log/apinto \
-v ${PWD}/config.yml:/etc/apinto/config.yml \
--name=apinto_node  eolinker/apinto-gateway:latest ./start.sh
Build API Gateway Cluster
-
Deploy a new node on another server following the deployment steps above
-
After deployment, enter the Docker container of any node (this step can be ignored for installation package deployment)
docker exec -it apinto_node bash
- Execute the join cluster command
./apinto join -addr {IP}:{port}
In the above command, values within {} are variables and need to be replaced with actual values.
- IP: Server IP
- Port number: Raft node communication port number in
config.ymlunder thepeerconfiguration section
An example is shown below:
./apinto join -addr 172.18.189.72:9401
Configure InfluxDB
Initialize InfluxDB
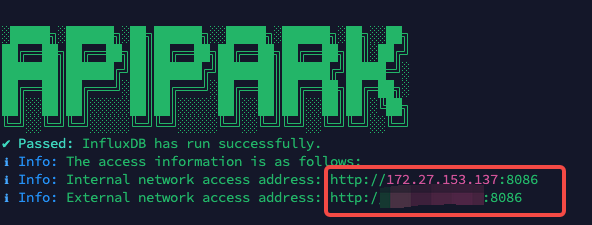
The one-click deployment script installs the InfluxDB database by default. After deployment, the access address of InfluxDB will be printed, as shown in the image below:
- Open the InfluxDB address in a browser.

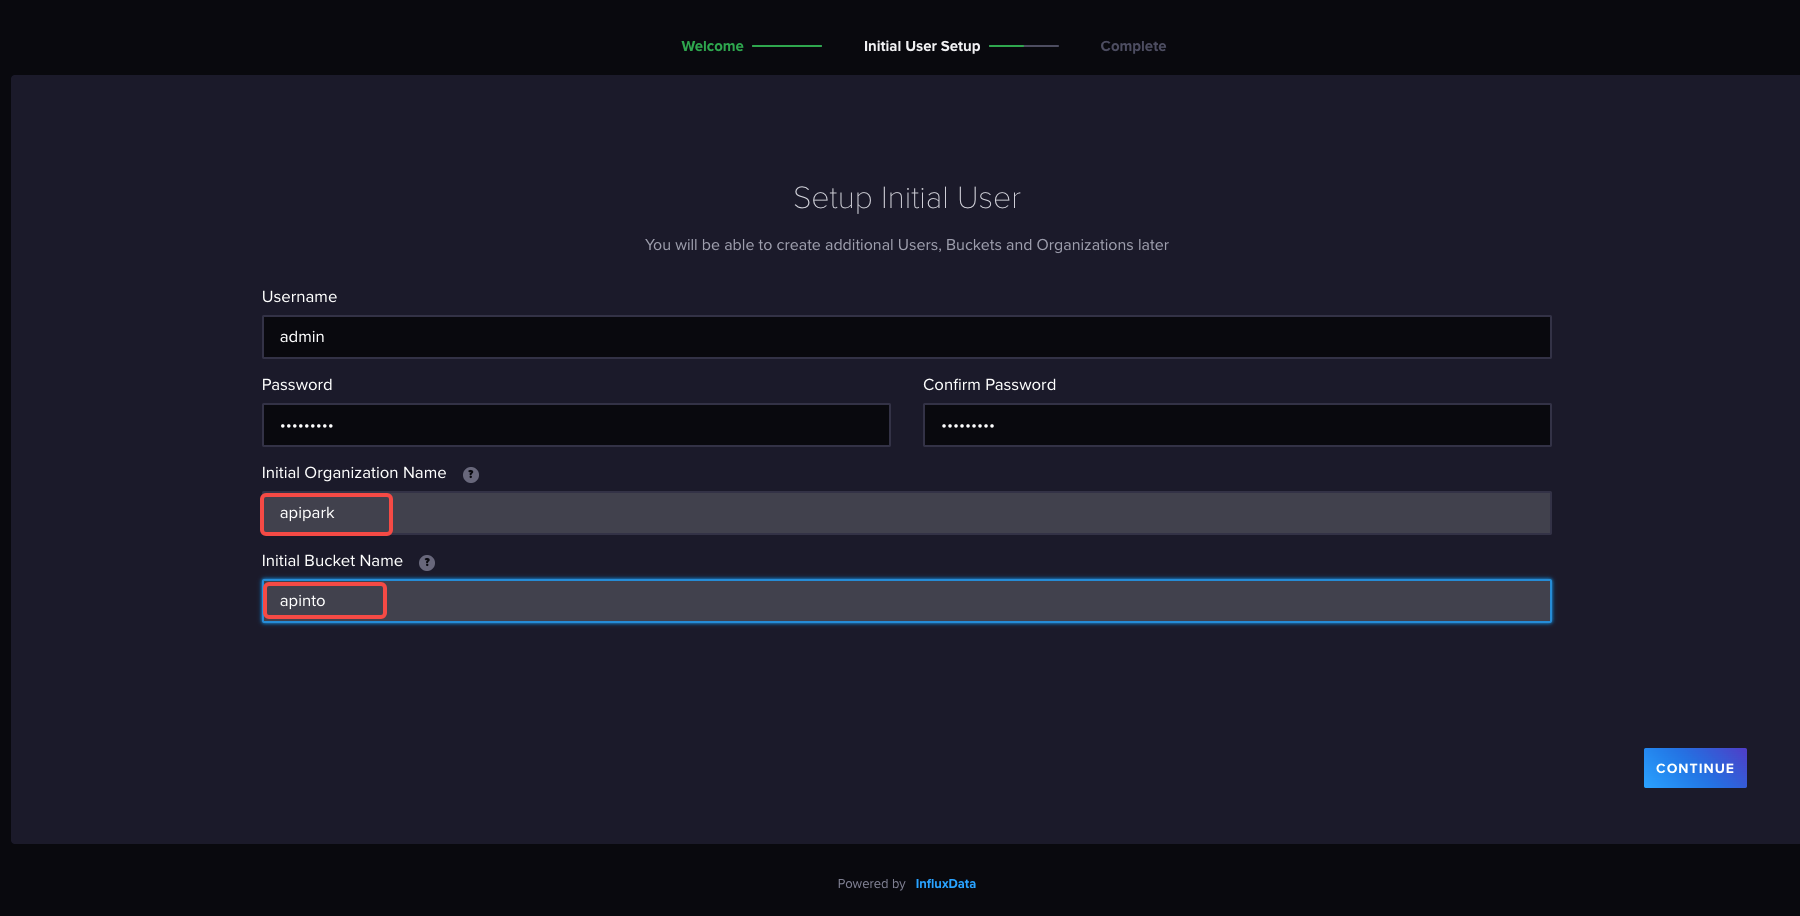
- Fill in the initialization information, including username, password, organization name, and Bucket name.
Here, fill apipark for Organization Name and apinto for Bucket Name.
Create API Tokens
InfluxDB's API Tokens are tokens used for authentication and authorization, allowing users and applications to securely access InfluxDB's data and functionalities. Their main functions are as follows:
- Access Control: API Tokens can be used to control who can access data in the InfluxDB database. Each token can be associated with different permission levels, restricting access to specific databases, organizations, or resources.
- Read/Write Permissions: API Tokens can distinguish between read and write permissions. You can create read-only tokens, write-only tokens, or tokens with read and write permissions, thus controlling the operational capabilities of different users or applications.
- Secure Communication: API Tokens can work together with HTTPS to ensure that communication with InfluxDB is encrypted and secure, preventing unauthorized access and data leaks.
- Multi-User Management: In multi-user or multi-tenant environments, API Tokens allow generating different tokens for each user or application, and assigning different permissions as needed.
- Audit and Tracking: Via API Tokens, it is possible to track which users or applications accessed which data and when, facilitating logging and security auditing.
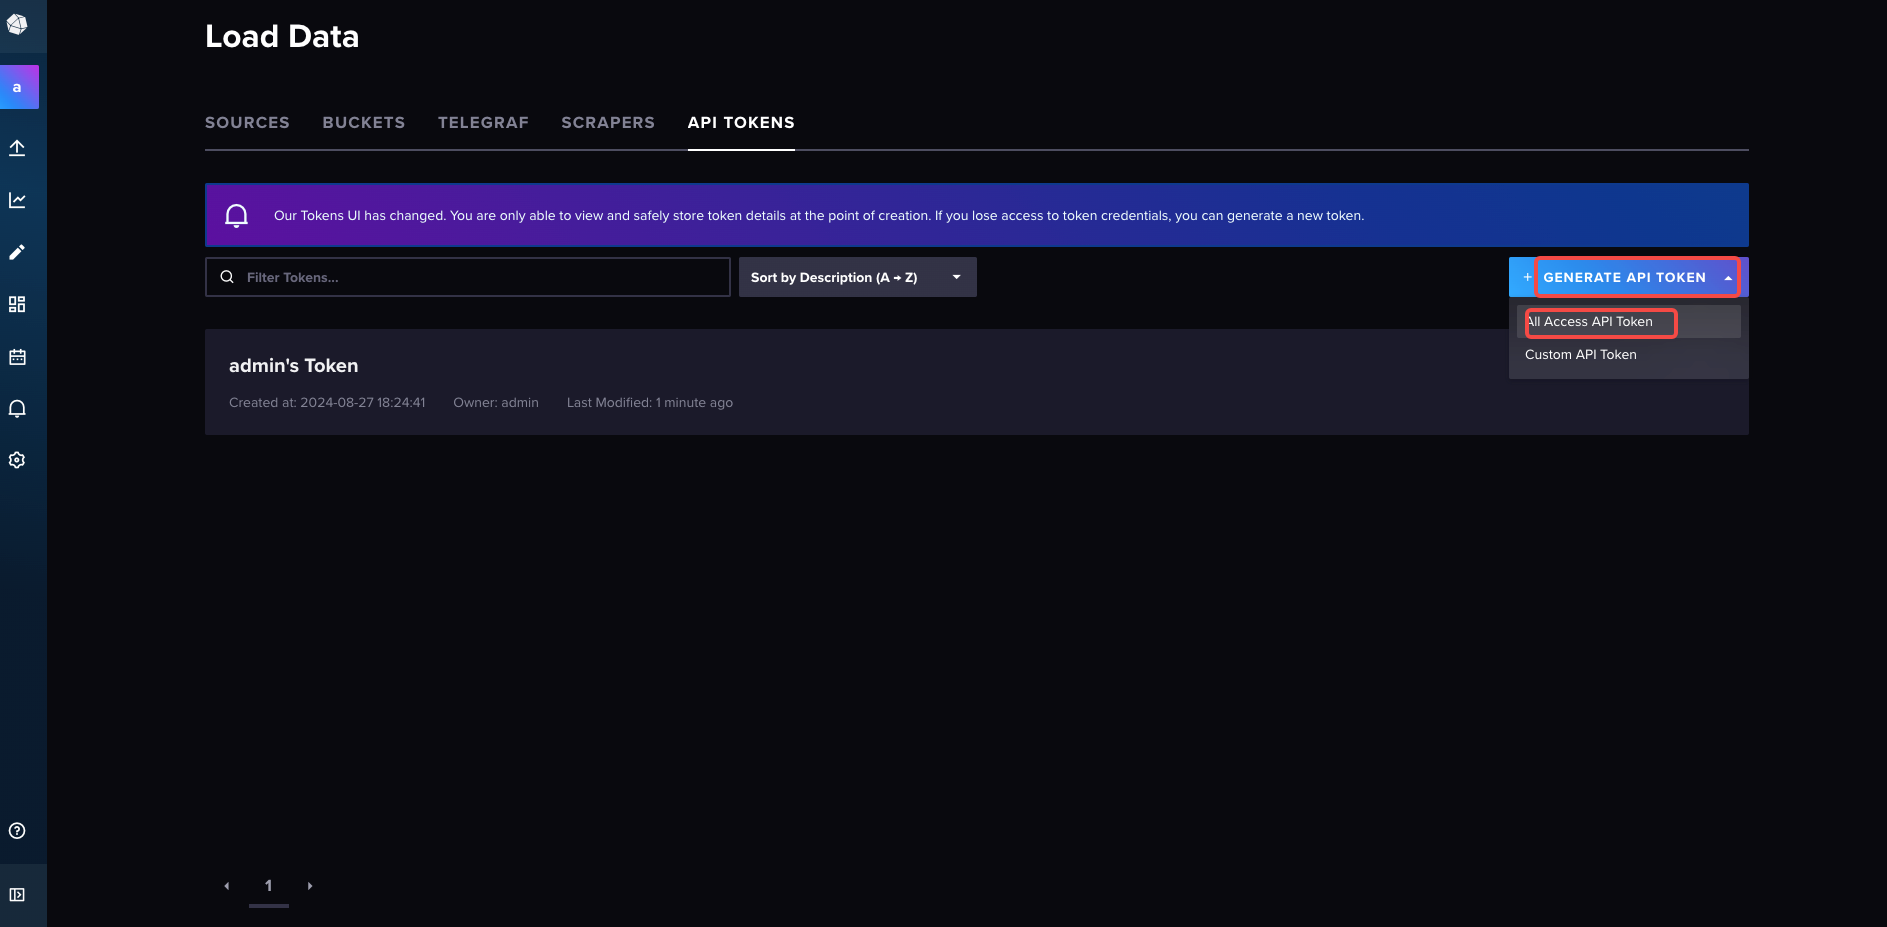
- Once on the InfluxDB web page, select
API Tokens.
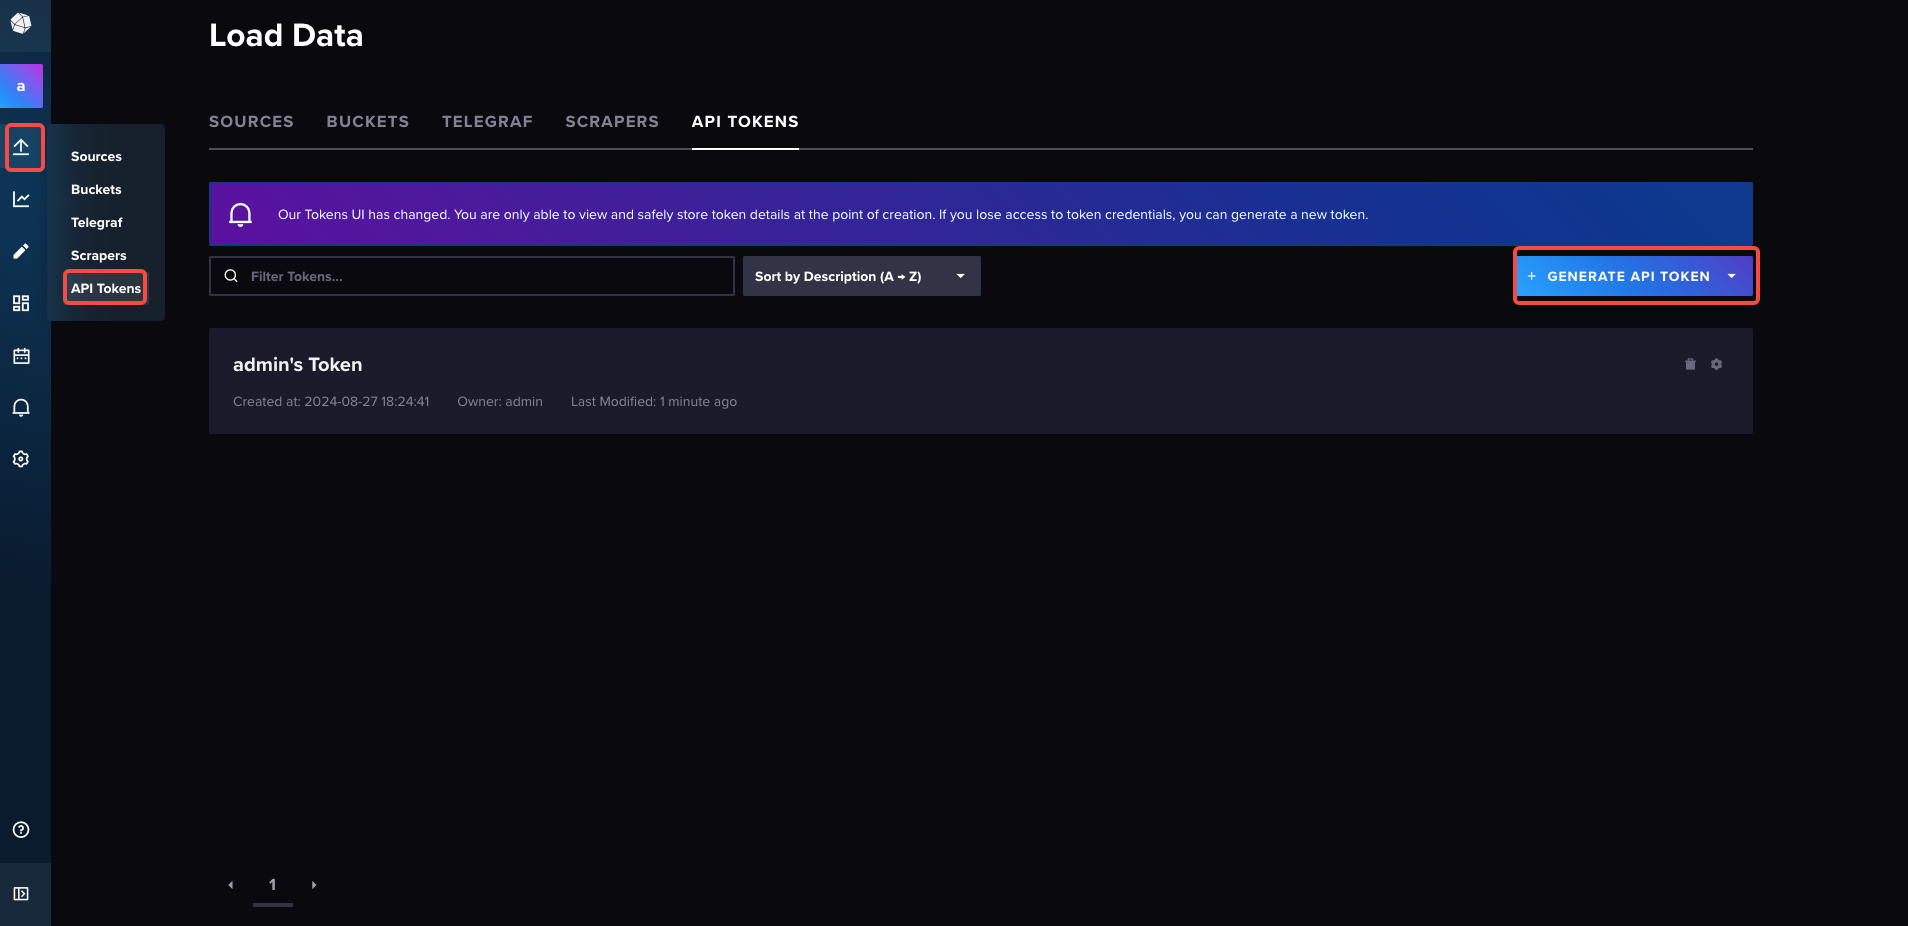
- Generate an
All Access API Token.
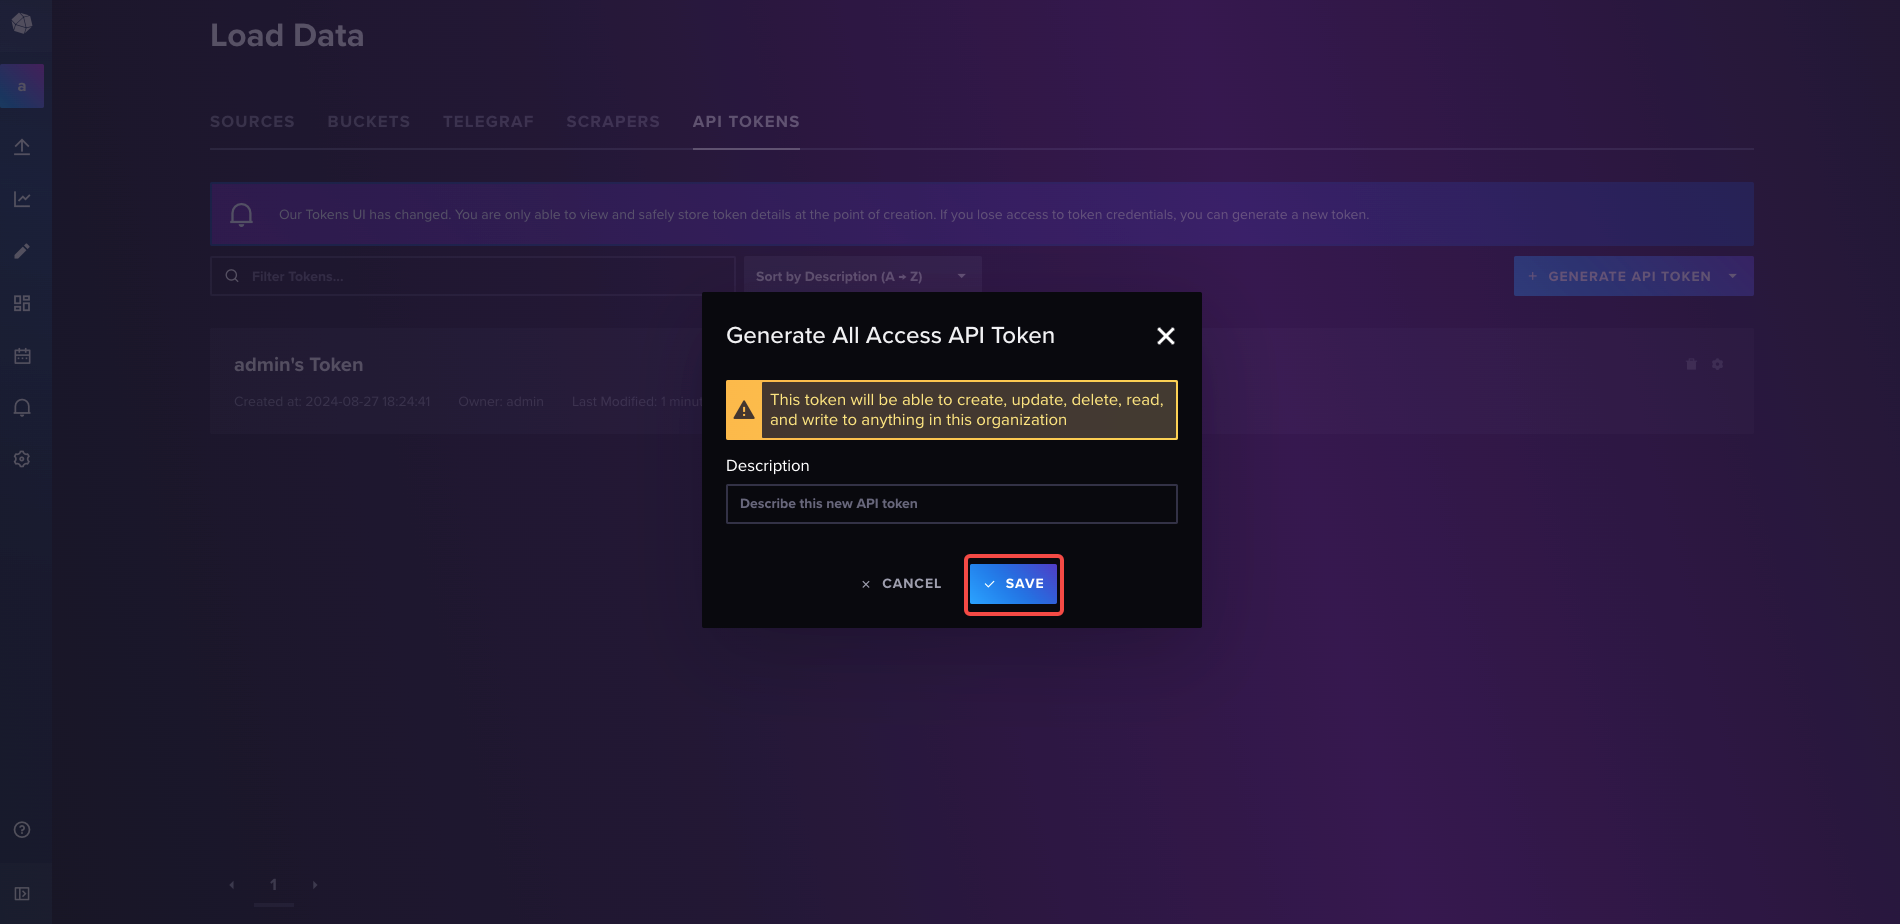
- Enter description information and click
SAVE.
- Copy the generated
API Token, which will be needed later when setting up APIPark data source.
